S&P 500
Large U.S. stocks
-1.09%

 STOCKS TO BUY NOW AI
Explore the market, research a company and compare your next idea. Start with the tools below.
Heatmaps, movers and the wider market.
Explore the businesses behind the tickers.
Compare strategies and model your payoff.
Follow disclosed insider and fund activity.
From the big picture to the details that matter.
Stocks to Buy Now AIPrice moves · Treasury changes in bp
Large U.S. stocks
Nasdaq-100 ETF
Small U.S. stocks
Precious metal
Energy prices
Digital currency
U.S. borrowing rate
U.S. borrowing rate
Top 710 gainers and decliners across 503 S&P 500 stocks in this snapshot.
Explore the ideas, then build your own perspective.
See the largest stocks and sector performance.
Explore a free snapshot of stock moves before the opening bell.
See saved stock moves after the regular session closes.
Explore market sentiment and its seven indicators.
Follow indices, gold, oil and Treasury yields.
Explore stock ideas and the research behind them.
Discover setups and review the original shared ideas.
Find company research by name or ticker.
Explore disclosed House and Senate trades, reporting dates and research signals.
Compare disclosed fund holdings, new positions and quarterly portfolio changes.
Follow reported executive and director transactions and explore insider buying signals.
Compare companies, industry metrics and P/S and P/E distributions.
Explore company fundamentals and forward-looking scenarios.
Study price trends, performance and technical indicators.
Understand the approach behind the analysis.
Explore volume, open interest, calls and puts.
Model a payoff, breakeven and the premium at risk.
Build and compare different ways to express a view.
Follow the latest news, research and company developments.
Plan the week ahead around company earnings.
Track economic events, central banks and key dates.
Start exploring for free. Go deeper with Pro.
Your daily view of the market.
Get oriented with public market tools and research previews.
Bring the research into focus.
Unlock member insights and the tools to explore each idea in the app. Live Pro web launches December 1, 2026, with a live video demo.
Research and educational tools. Investing involves risk; membership does not guarantee returns.
Explore independent ratings and reviews on Google Play and the Apple App Store.
Start with the market. Explore the heatmap, follow the calendar and put the day’s moves in context.
Explore the marketBring stock ideas and company fundamentals together. Explore the business behind the ticker.
Explore stock researchMake room for research, learning and a daily investing routine. All in one place.
Discover the app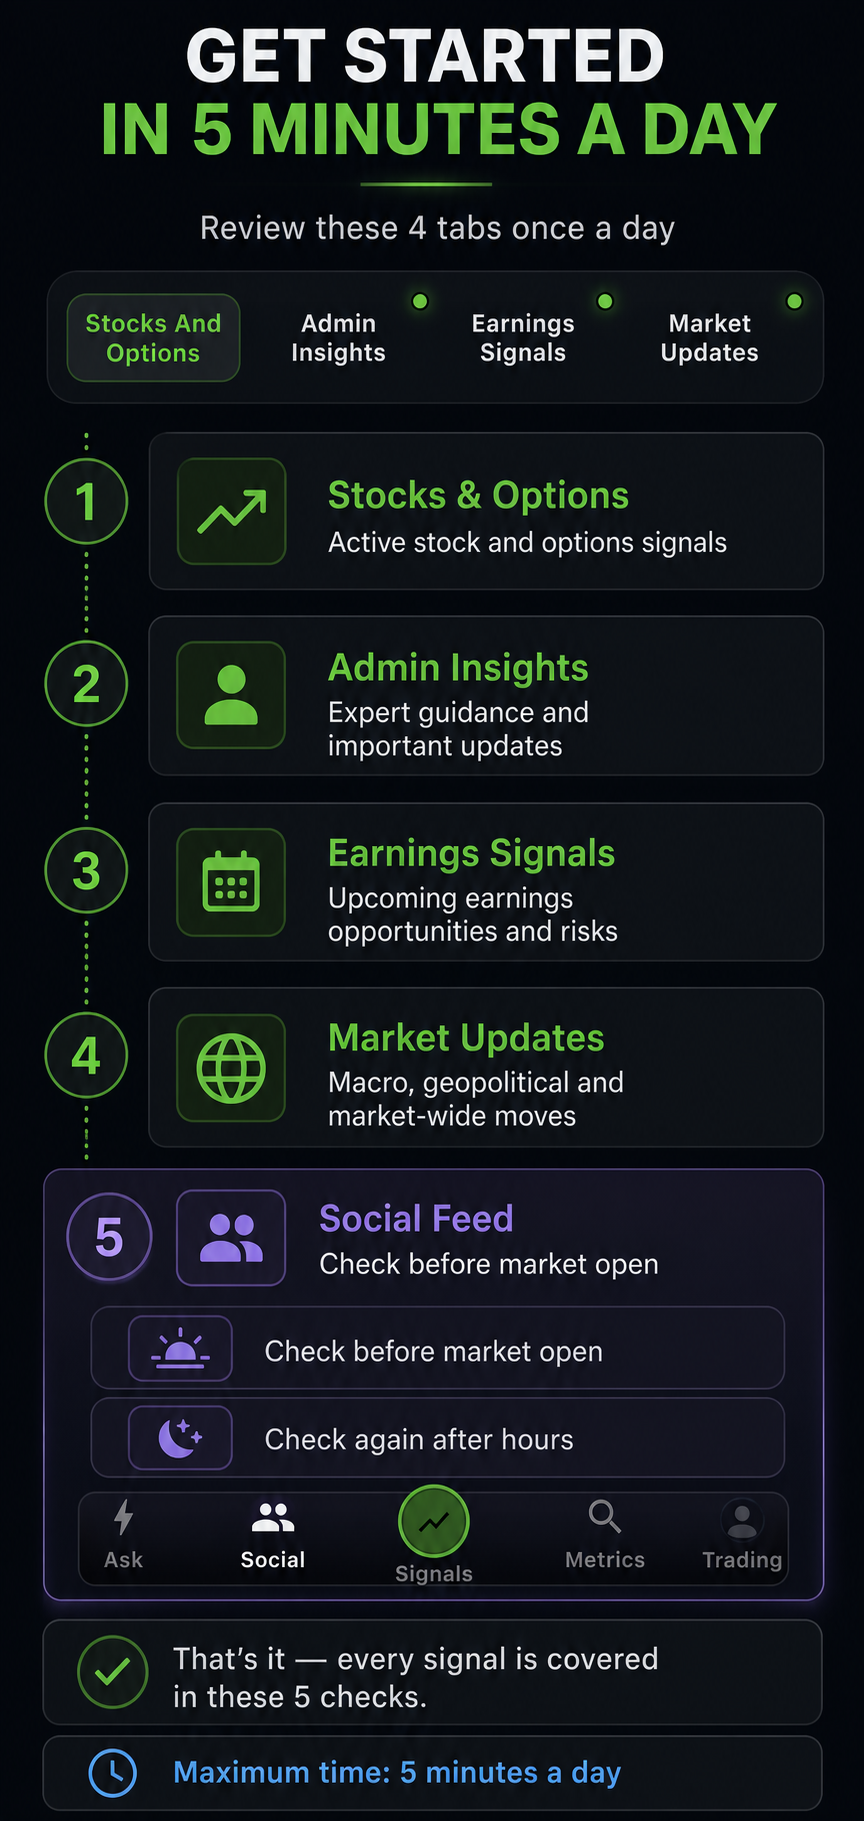
POLITICIANS · HEDGE FUNDS · INSIDERS
A new perspective on your next idea. Explore disclosed trades, institutional holdings and the evidence behind research signals.
House & Senate disclosures. See who reported a purchase or sale, the size range and the reporting delay.
Trade date + disclosure date02 / DISCLOSURE RESEARCH↗Explore disclosed portfolios and compare share counts between quarters for selected institutional managers.
Quarter-end positions · Form 13F03 / DISCLOSURE RESEARCH↗Follow reported executive and director transactions. Separate purchases and sales from awards and other activity.
Transaction date + filing dateSee the pattern. Check the evidence. Take the next step.
One stock. Multiple buyers. A cluster of purchases one week before earnings gives you a reason to look closer.
Review the buyers, original filings, financials and technicals.
Politicians disclose purchases in the same stock ahead of Trump’s next meeting.
Review the buyers, original filings, financials and technicals.
Built for better decisions
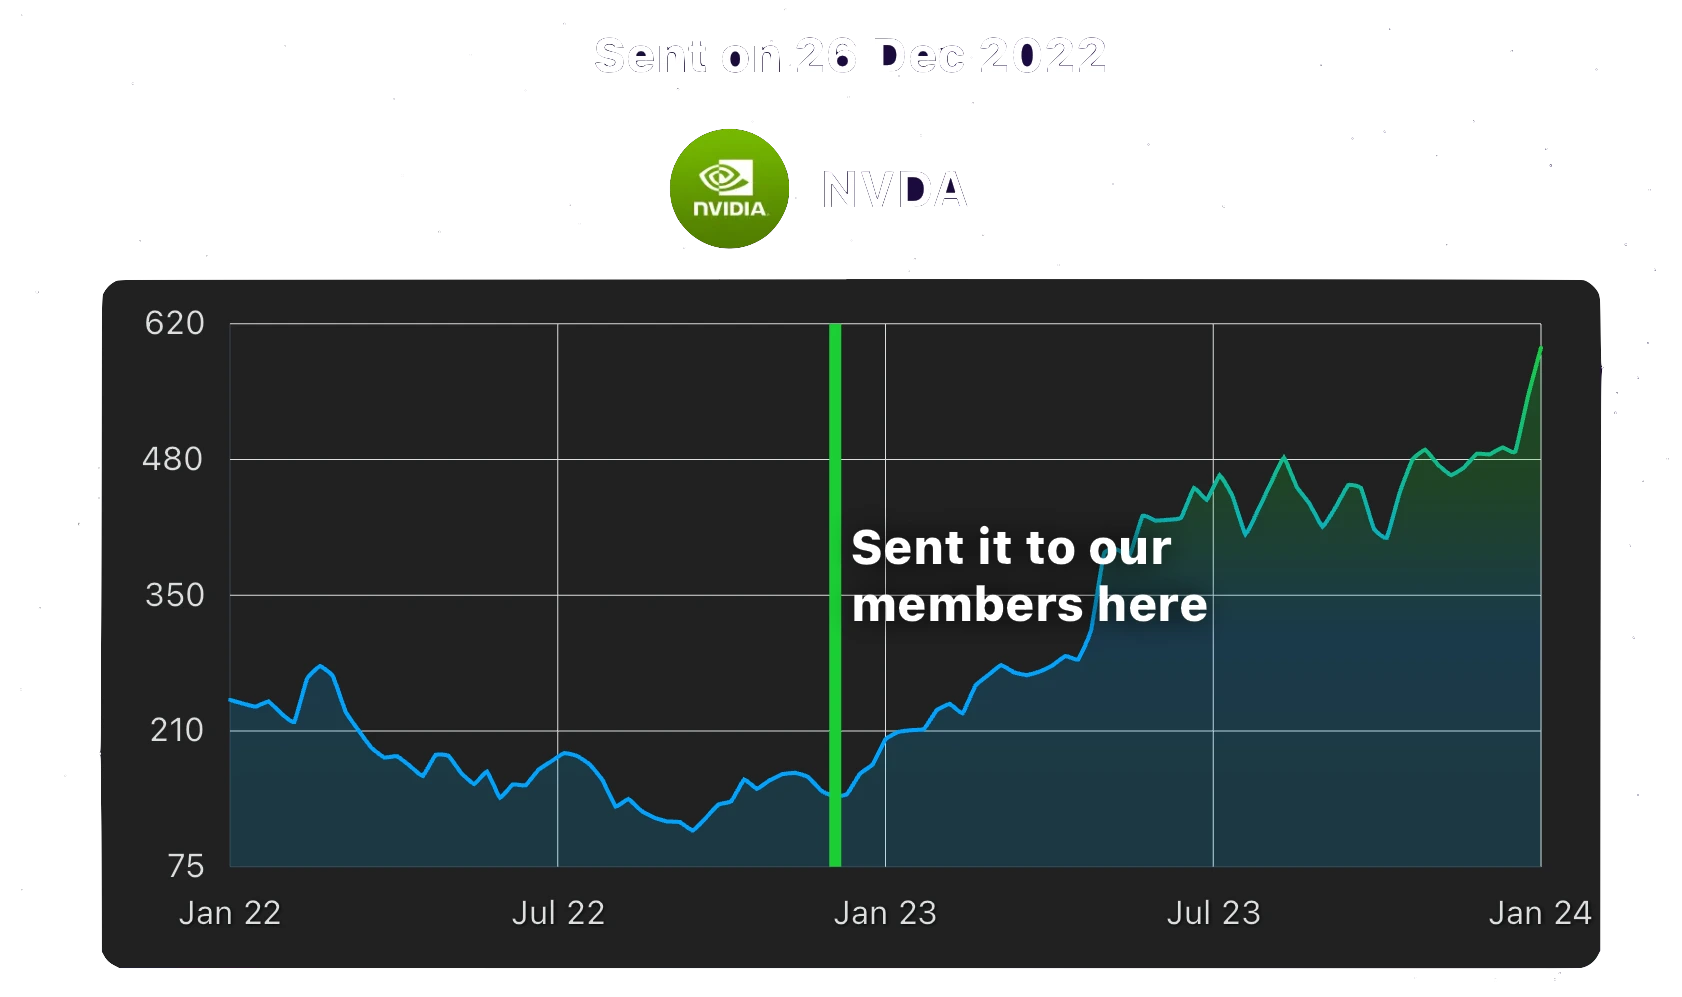

A preview of recent setups, with price trends and business metrics. Open the signals page to explore more.
Loading signal previews…
Loading earnings…
Will a company beat earnings expectations this quarter? We use market conditions, industry reporting, product releases and recent company news to inform our earnings predictions.
Put this quarter’s earnings expectations in context with the economic backdrop and market conditions.
An earnings beat does not guarantee a rising stock price. Predictions are not guarantees.
Economic releases, Fed decisions, 13F filings and index reviews.
Loading your week…
Review our daily S&P 500 and QQQ predictions. We combine market events, statistical analysis, news research and Wall Street research to estimate how the market could move.
Explore potential holdings ahead of 13F filings using recent public data, news and previously disclosed position changes. Assess possible index additions using eligibility rules, company rankings and corporate developments. These are research candidates until filings or index announcements confirm them.
Explore the daily outlook for the broader U.S. market, with the events and research behind the forecast.
Forecasts can change as new information arrives. Predictions are not guarantees.
Explore positioning, model a payoff and compare ways to express your view.
Call and put open interest across available expirations.
Loading options snapshot…
Totals cover available contracts.
Largest open-interest strikes. Call/put totals do not establish market direction.
Read unusual volume, open interest and call/put positioning together. Learn which clues deserve attention—and what the numbers cannot reveal.
Compare strikes and expirations through volume, open interest and available volatility. Build a shortlist with liquidity and timing in mind.
Explore calls, puts and spreads. Map the premium at risk, breakeven and expiration payoff before choosing your setup.
Unusual volume. Call and put positioning. Liquidity and strategy selection. Bring the clues together as you explore options opportunities and research-backed signals in the app.
Curious about “smart money”? Look for activity worth investigating, then connect it with company catalysts and a strategy that fits your outlook.
Explore elevated contract volume alongside open interest, price action and upcoming catalysts. Investigate the setup behind the activity before choosing a trade.
Options activity does not identify hedge funds or confirm what “smart money” is buying. Signals are research ideas; options can lose their entire premium.
Explore shipping flows and the context behind unusual market activity.
Timing matters. Explore the research, the trade and the community behind a standout SPY options example.
Explore this 67× SPY options result A selected historical community example, not a typical result. Options can lose their full premium.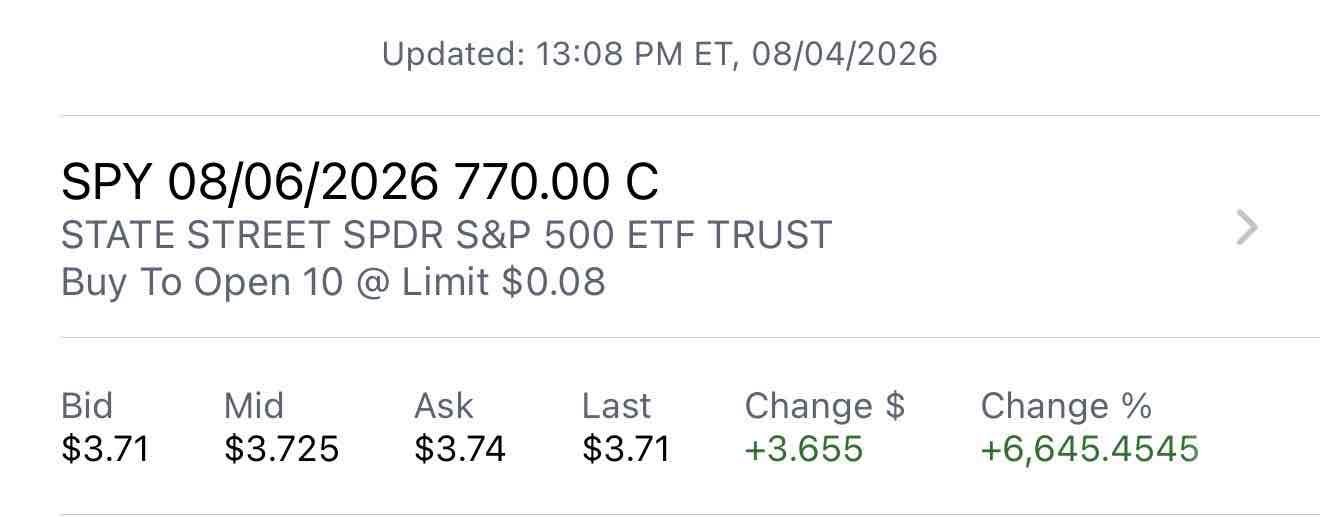
All app research previews published in the past week. These are not live quotes or a ranked list of buys.
 The week of October 26–30, 2026 brings major earnings reports across technology, payments, healthcare, energy and consumer goods. The key question is whether sales growth is turning into cash and stronger outlooks.
1) The week ahead and how to read the numbers
This week's earnings · Oct 26, 2026 – Oct 30, 2026 ISRG politician signal: 2 reporting investors
The disclosure signal
 Top Market Events to Watch This Week (Oct 26–30, 2026 | U.S. Eastern Time)
Market direction will likely depend on what the Fed says about future rate cuts and whether Thursday’s inflation and GDP reports show a healthy balance between cooling prices and steady growth. Expect the largest moves in technology stocks, banks, homebuilders, consumer stocks, a
 Weekly market recap · October 19–23, 2026Daily insider and fund activity — October 23, 2026
Insider sales
Closing market recap : Oct 23, 2026, 5:00 PM ET Next session earnings · Oct 26, 2026+336% since previous close · PANW $357.5 Call · $5.20 → $22.66
PANW moved +6.95% since the previous close. The $357.5 call rose from $5.20 to $22.66 per share. One standard contract covers 100 shares: $520.00 became $2,266.00, a $1,746.00 increase before costs. If the stock finishes at or below $357.5, the option expires worthless and the fu
 T-Mobile traded at $149.08, down 6.11% in the regular session on October 23, 2026 at 2:22 PM Eastern, versus the previous regular close.
 Datadog traded at $272.52, up 5.73% in the regular session on October 23, 2026 at 1:51 PM Eastern, compared with the previous regular close.
 CrowdStrike traded at $253.16, up 6.40% in the regular session on October 23, 2026 at 12:51 PM Eastern, compared with the previous regular close.
 +276% since previous close · SLB $49.5 Call · $1.01 → $3.80
SLB moved +7.34% since the previous close. The $49.5 call rose from $1.01 to $3.80 per share. One standard contract covers 100 shares: $101.00 became $380.00, a $279.00 increase before costs. If the stock finishes at or below $49.5, the option expires worthless and the full $101.
 AT&T traded at $21.42, down 5.80% in the regular session on October 23, 2026 at 12:36 PM Eastern, versus the previous regular close.
 TSM politician signal: 3 reporting investors
The disclosure signal
 Globe Life traded at $157.00, down 6.78% in the regular session on October 23, 2026 at 12:24 PM Eastern, compared with the previous regular close.
 CBRE traded at $123.58, down 5.84% in the regular session on October 23, 2026 at 11:52 AM Eastern, compared with the previous regular close.
 Tonight's earnings · Oct 23, 2026SLB traded at $52.91, up 6.78% in the regular session on October 23, 2026 at 11:22 AM Eastern, versus the previous regular close.
 +117% since previous close · CCI $75 Call · $6.05 → $13.10
CCI moved +10.92% since the previous close. The $75 call rose from $6.05 to $13.10 per share. One standard contract covers 100 shares: $605.00 became $1,310.00, a $705.00 increase before costs. If the stock finishes at or below $75, the option expires worthless and the full $605.
 Comfort Systems USA traded at $1,189.83, down 7.00% in the regular session on October 23, 2026 at 11:22 AM Eastern, versus the previous close.
 RAPP insider signal: 4 reporting investors
The disclosure signal
Crown Castle rose 15.68% to $91.19 in pre-market trading on October 23 at 9:27 AM Eastern, versus its $78.83 October 22 close, following reports of SpaceX tower-access talks. ExxonMobil reports third-quarter 2026 results on October 30, 2026 at 6:30 AM Eastern, with its call at 9:30 AM. This is a preview; the quarter has not been released.
1) When will ExxonMobil report, and what estimates are available?
October 23, 2026 premarket: tower stocks lead the gainers, while Deckers and wireless carriers lead the declines. These are saved early quotes versus the October 22 regular close, not opening prices.1) How to read the October 23 premarket snapshot
 Bloom Energy (BE) reported record Q3 2026 revenue of $1.24 billion and raised its full-year outlook, while cash consumption and the stock reaction temper the headline strength.
 +380% since previous close · ACN $245 Call · $2.28 → $10.94
ACN moved +6.69% since the previous close. The $245 call rose from $2.28 to $10.94 per share. One standard contract covers 100 shares: $228.00 became $1,094.00, a $866.00 increase before costs. If the stock finishes at or below $245, the option expires worthless and the full $228
 Coca-Cola will report Q3 2026 results before the market opens on October 27, with its conference call scheduled for 8:30 AM Eastern.
1) When is Coca-Cola reporting Q3 earnings?
 Intel will report Q3 2026 results after the market closes on October 29, with its conference call scheduled for 5:00 PM Eastern.
1) When will Intel report Q3 earnings?
 Mastercard will discuss Q3 2026 earnings on October 29, with its conference call scheduled for 9:00 AM Eastern.
1) When is Mastercard reporting Q3 earnings?
 Visa will report fiscal fourth-quarter and full-year 2026 results after the market closes on October 27, with its conference call at 5:00 PM Eastern.
1) When will Visa report fiscal Q4 and full-year earnings?
 Eli Lilly will report Q3 2026 results on October 29, with its earnings conference call scheduled for 10:00 AM Eastern.
1) When will Eli Lilly report Q3 earnings?
 Seagate fell in October 22 after-hours trading ahead of its fiscal first-quarter 2027 report scheduled for October 27 after the close.Verizon fell in October 22 after-hours trading ahead of its third-quarter earnings release on October 26.
 Western Digital fell in October 22 after-hours trading after releasing fiscal first-quarter 2027 results that evening.AT&T fell in October 22 after-hours trading; its third-quarter results were released on October 21, rather than this evening.
 Amazon will discuss Q3 2026 earnings on October 29, with its conference call scheduled for 5:00 PM Eastern.
1) When is Amazon reporting Q3 earnings?
Closing market recap : Oct 22, 2026, 5:00 PM ET Next session earnings · Oct 23, 2026
 +414% since previous close · ROP $430 Call · $3.50 → $18.00
ROP moved +9.06% since the previous close. The $430 call rose from $3.50 to $18.00 per share. One standard contract covers 100 shares: $350.00 became $1,800.00, a $1,450.00 increase before costs. If the stock finishes at or below $430, the option expires worthless and the full $3
Alphabet is scheduled to discuss Q3 2026 earnings on October 28, with its conference call at 4:30 PM Eastern.1) When is Alphabet reporting Q3 earnings?
 Microsoft will release fiscal first-quarter 2027 earnings after the US market closes on Wednesday, October 28, 2026.
1) When is Microsoft’s next earnings report?
 Lam Research reported fiscal Q1 2027 revenue of $8.22 billion, up 54% year over year and 22% from the previous quarter.
 Blackstone’s Q3 fee-related earnings increased 6% to $1.572 billion, while distributable earnings declined 9% to $1.716 billion.
 Coherent’s latest reported quarter delivered $2.05 billion in revenue, up 34% year over year; its next results are due November 4 after the close.Roper reported Q3 revenue of $2.172 billion, up 8%, including 7% organic growth and 1% from acquisitions.
 Allegion reported Q3 revenue of $1.173 billion, up 9.6%; organic growth was 7.2%.Tonight's earnings · Oct 22, 2026
 Nasdaq ($NDAQ +6.5%) reported Q3 net revenue of $1.481 billion, up 13% year over year and 14% organically.
Nasdaq returned $496 million to shareholders through $173 million in dividends and $323 million in share repurchases.
 Lennar $LEN +7% reported fiscal Q3 2026 results on September 16, covering the quarter ended August 31.
Lennar repurchased $256 million of shares, but management said housing conditions had deteriorated.
 Lockheed Martin beat Q3 expectations: revenue rose 11% to $20.7 billion, while EPS reached $7.97 versus $7.43 expected.
Planned year-end capital spending targets increased munitions production.
Market recap : Oct 22, 2026, 10:19 AM ET Next session earnings · Oct 22, 2026
 Meta’s Q3 revenue rose 26% year over year to $64.60 billion, beating expectations of $63.37 billion by roughly 1.9%.
Investor focus remains on whether revenue growth can offset heavy AI spending and legal costs. The report also cited a $25 billion New Mexico penalty; Reality Labs’ quarterly results were still pending.
 Tonight's earnings · Oct 21, 2026
Meta Platforms, Inc. #META · Oct 21, 2026 · After close
 JPMorgan raised its SpaceX price target to $500 from $240, more than doubling its previous target.Next session earnings · Oct 21, 2026
 Market recap : Oct 20, 2026, 2:24 PM ET
 Tonight's earnings · Oct 20, 2026
 Broadcom signed a 10-year agreement with NTT DOCOMO to advance the private cloud supporting DOCOMO’s digital services.Next session earnings · Oct 20, 2026Eli Lilly announced positive late-breaking one-year results from the Phase 3 SHINE-2 study of Omvoh in pediatric ulcerative colitis.
The treatment addresses significant unmet medical needs in a population where 54% of enrolled patients had previously failed biologic therapy.
We track fundamentals, technicals, earnings catalysts and the market environment to identify our best stocks to buy now and send you research-backed ideas through the app.
Understand the business through revenue, profitability, valuation and financial strength.
Research ideas to evaluate, with risks to consider. Returns are not guaranteed.
Headlines from external publishers
 WTIFXEmpire
 RNGSeeking AlphaSPCXBusiness Insider
 PLSeeking Alpha
 ELThe Motley Fool
 GGPSFSeeking Alpha
 SOBKYCNBC
 LNVGYInvezz
 P-ANTHThe Motley Fool
 NVDAThe Motley Fool
 XSPISeeking Alpha
Curious which stocks are mentioned most in the news? Choose your perspective, then continue your research with AI in the app.
Select a window above to see which stocks are mentioned the most. Turn the news you read into companies worth researching.
Explore in the app · iOS & Android
Personal trades from the founder, based on past signals, industry growth prospects and business competitive MOAT analysis.
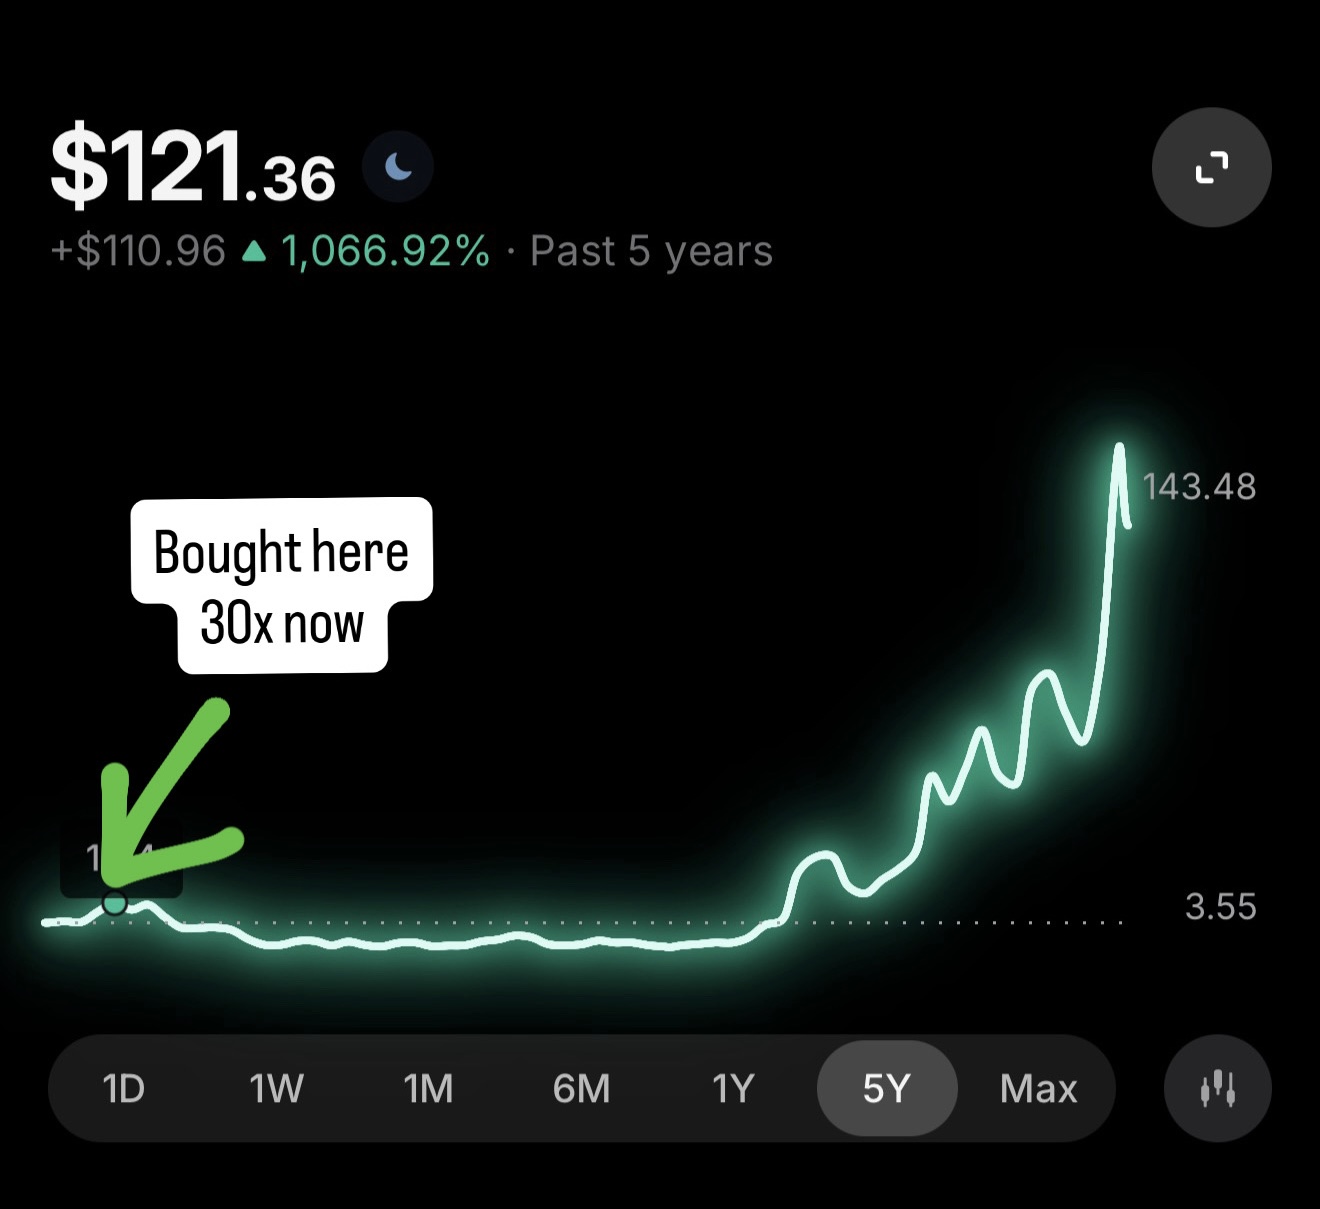
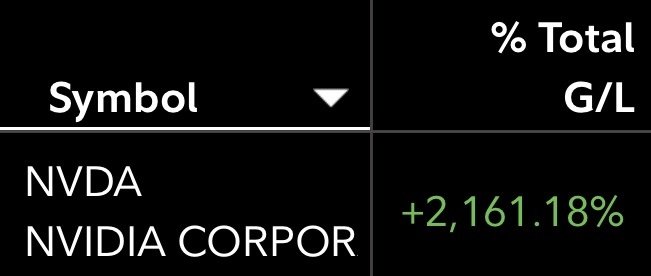
A real life trade from the founder executed with Fidelity.
These are professional investors past performance. Past performance does not guarantee future performance.
Explore historical examples alongside the business growth data available inside the app.
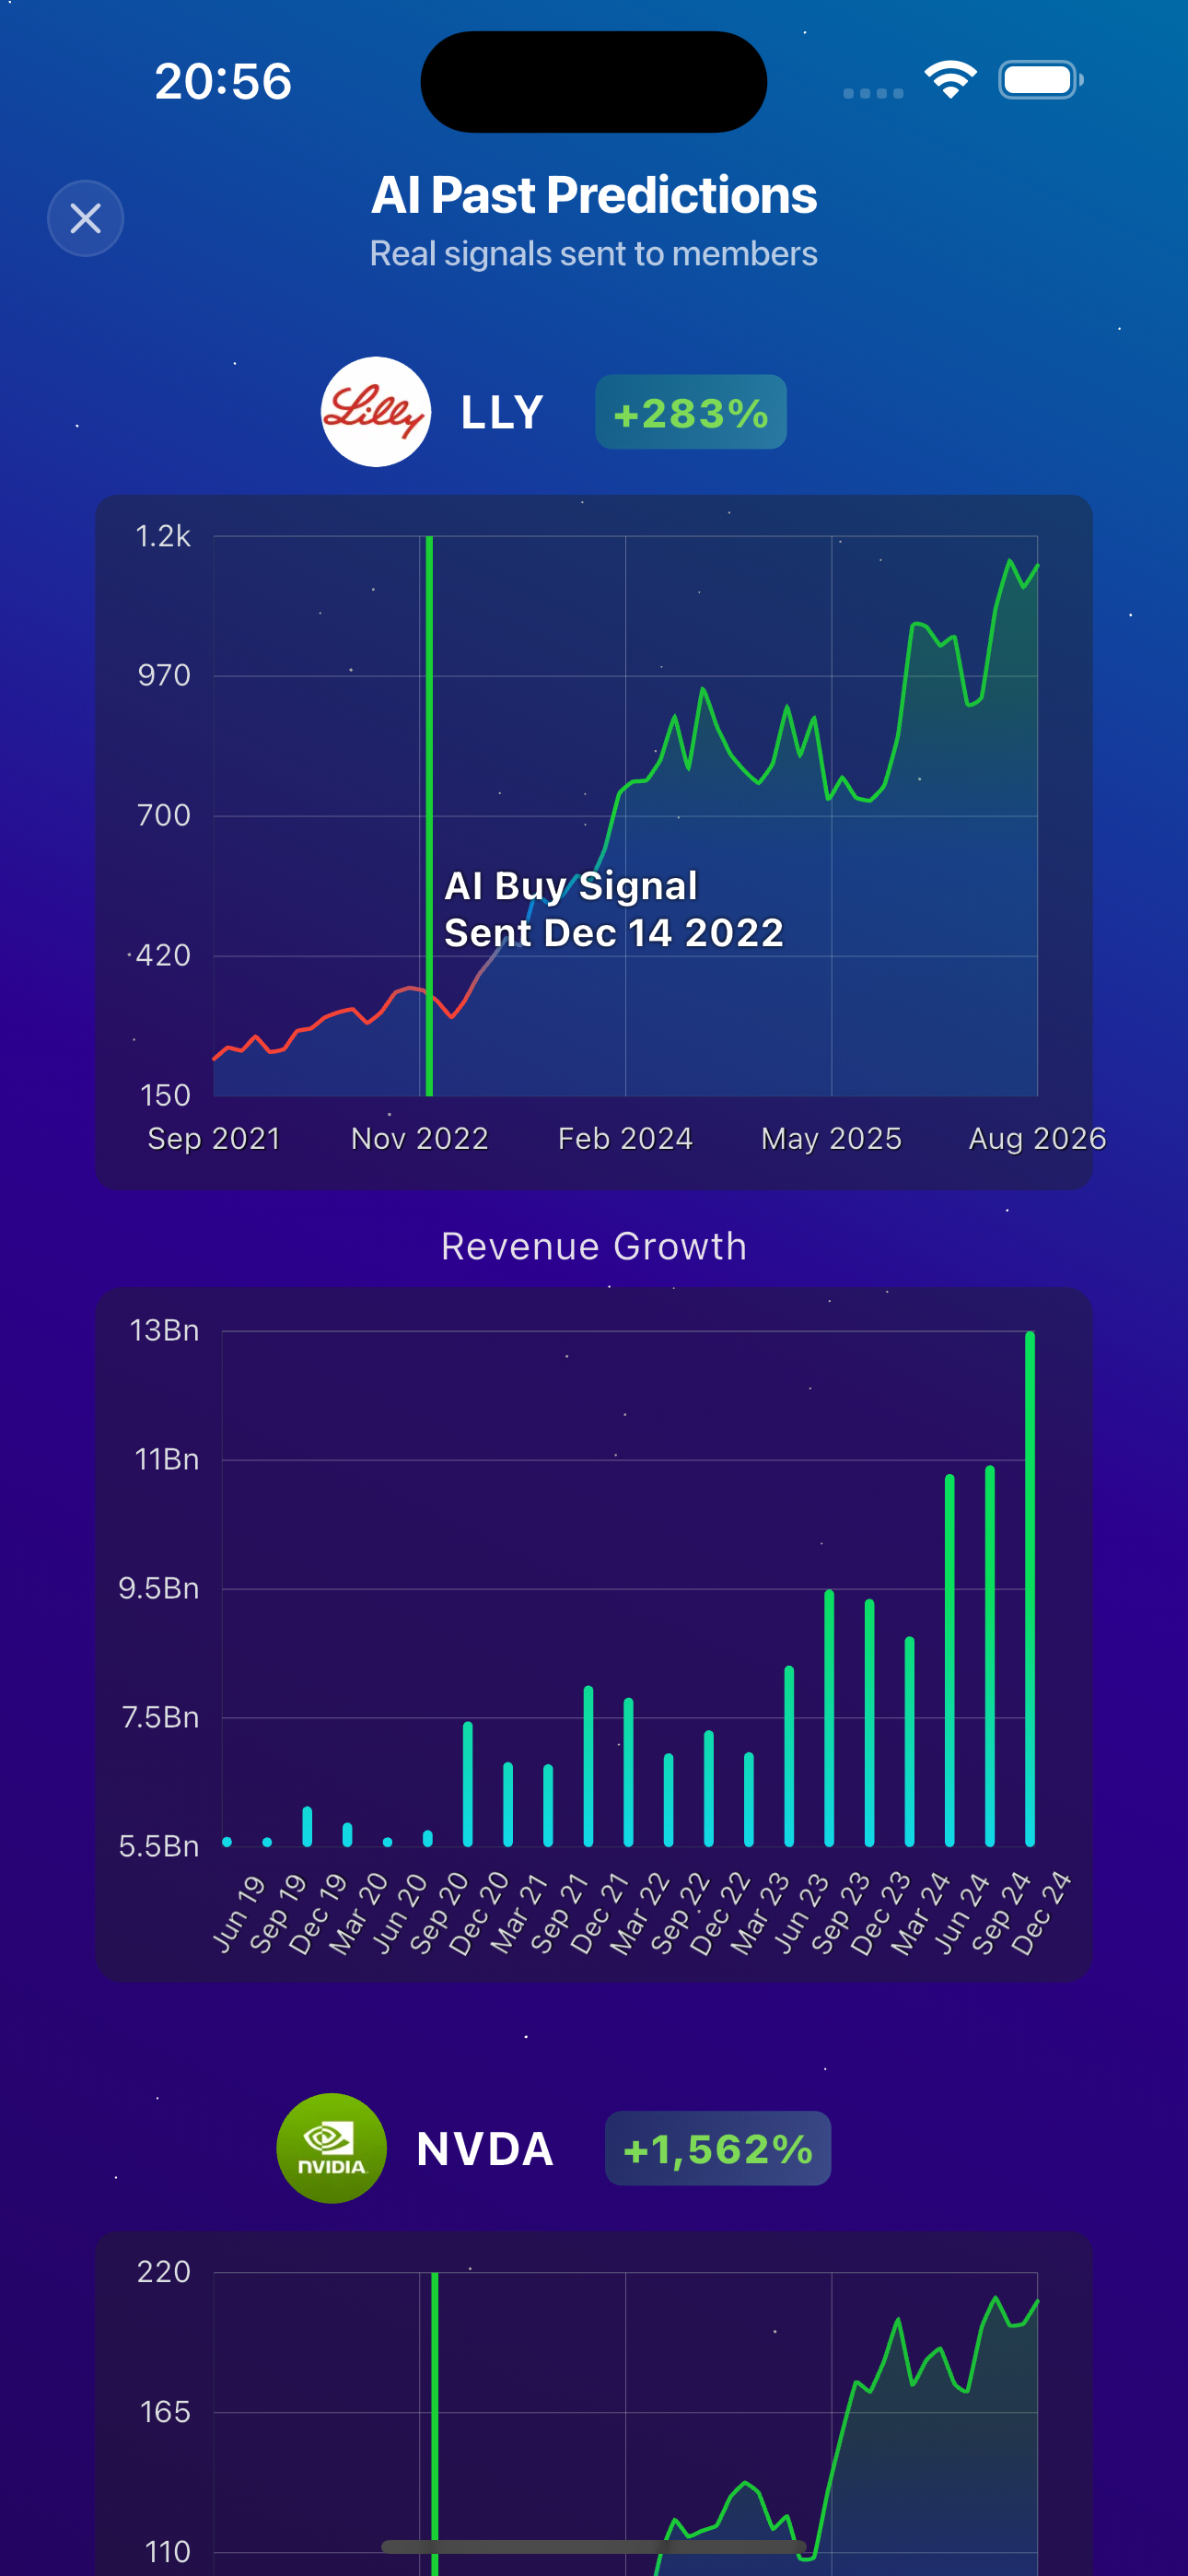
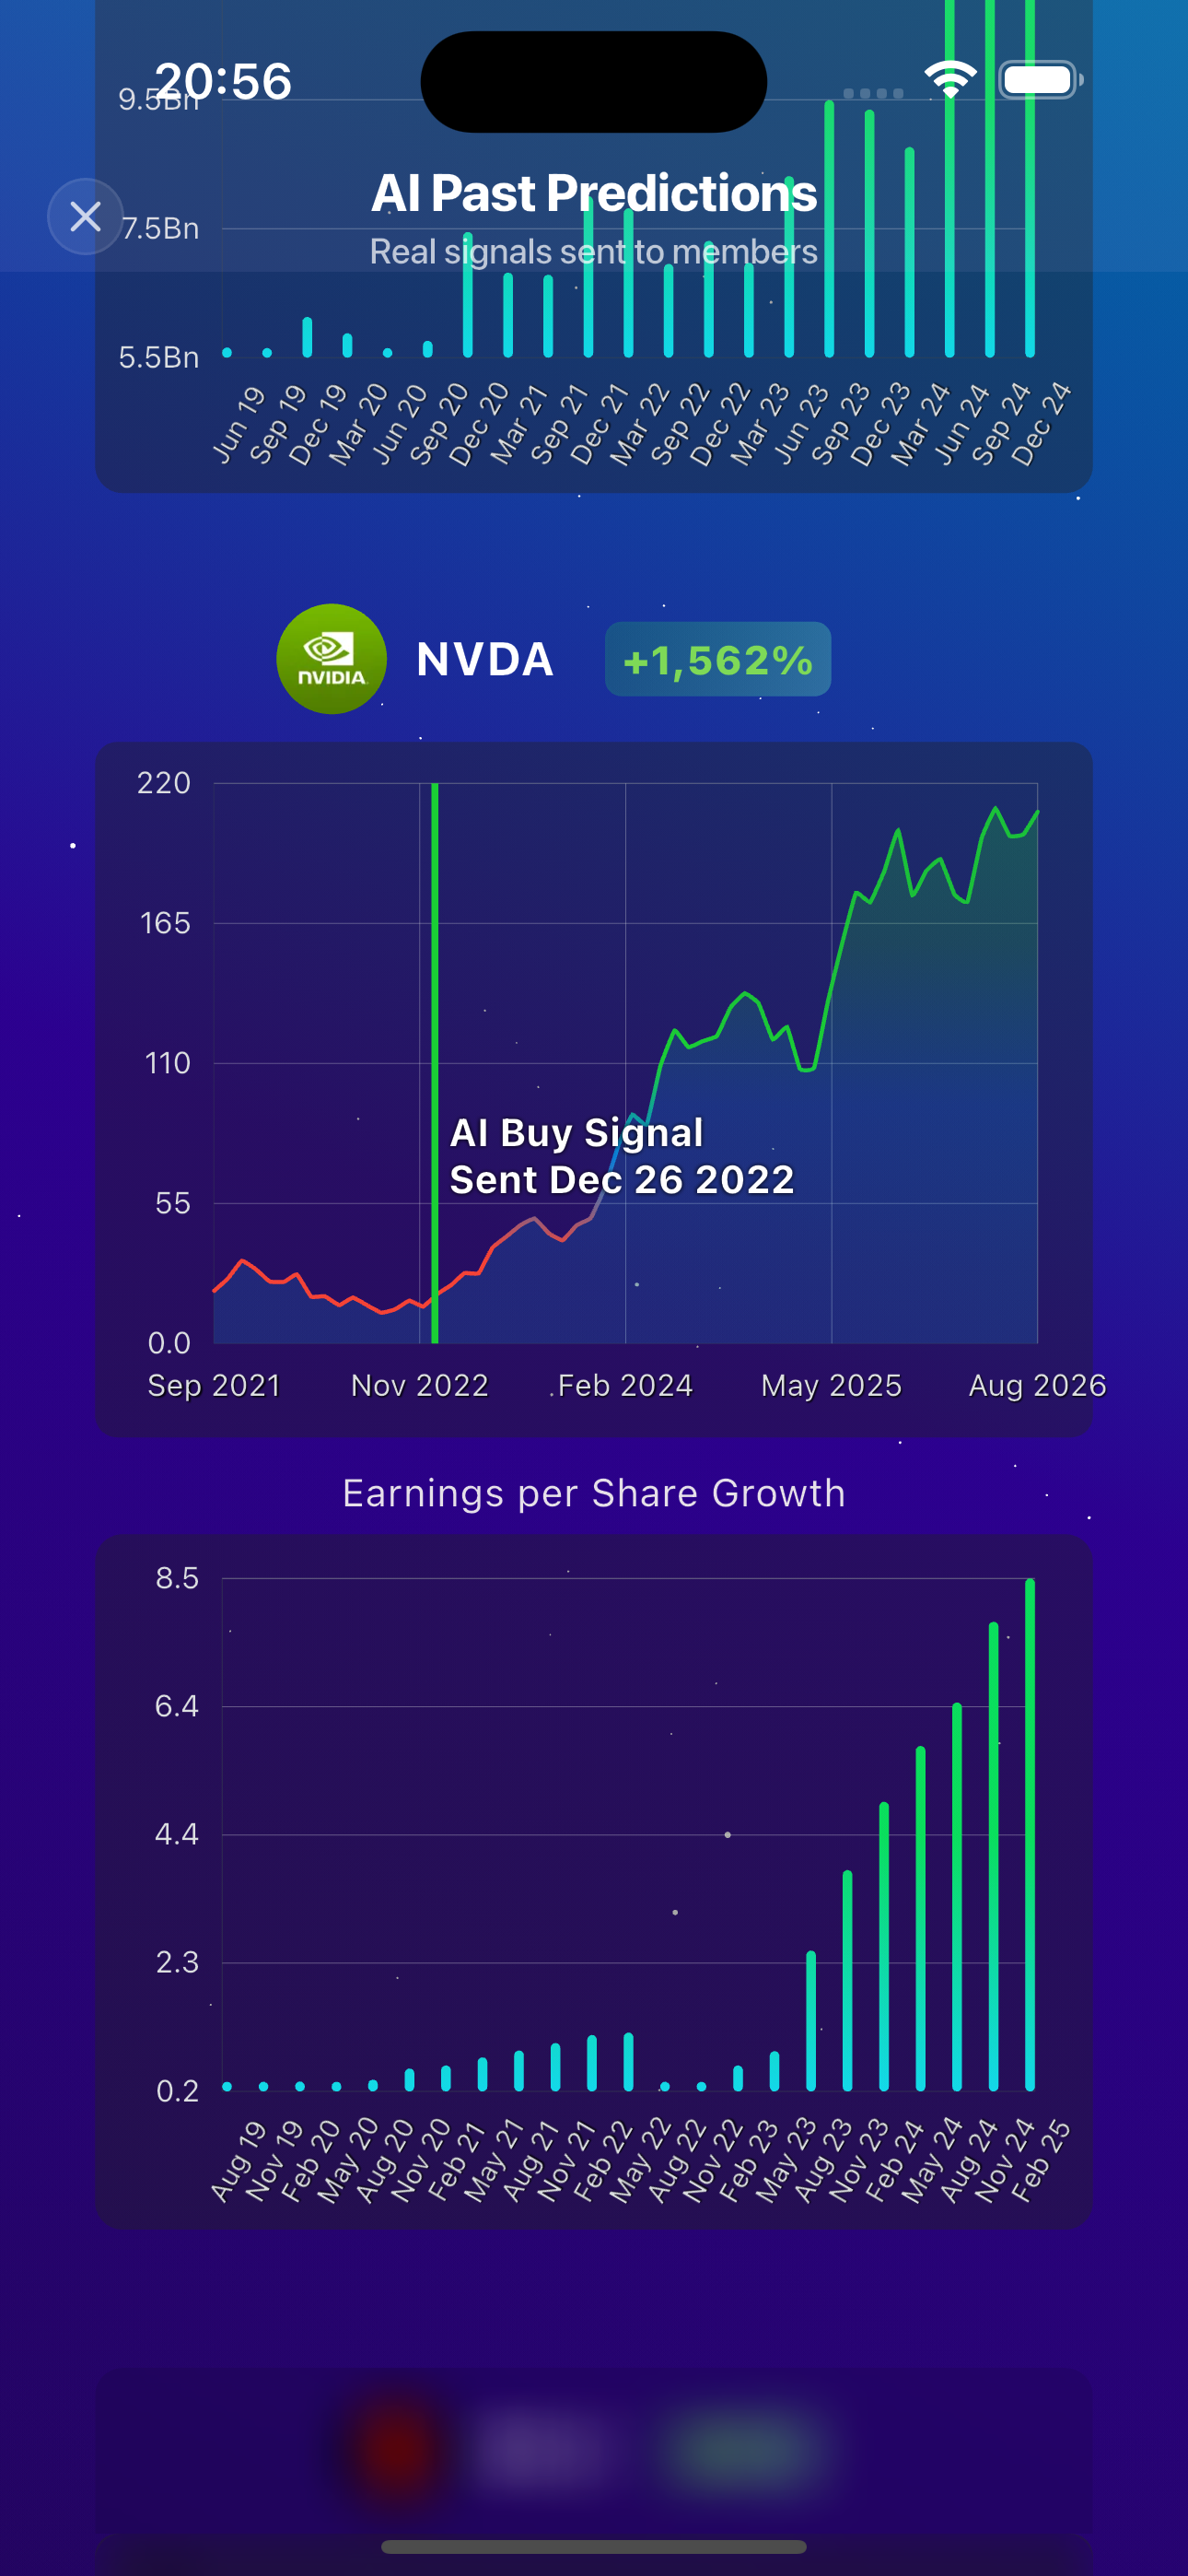
Historical examples are shown for educational purposes only. Past performance does not guarantee future results.
Try Risk-Free Paper Trading →
Built by market expertise
Statistician, economist, trader, data scientist and software engineer.
Aness combines institutional-market experience with statistics, economics and technology to make sophisticated investing research clearer and more practical. His background includes financial engineering at UC Berkeley Haas, advanced studies in statistics and finance, and experience across trading, asset management and risk.
Learn for Free
Interactive calculator
Illustrative projections only. Returns are not guaranteed and this is not financial advice.
Search the app’s full stock catalog →
There is no universal best stock. Start with companies whose business you understand, compare growth with valuation, and consider risks and your time horizon. Our company research pages organize evidence and recent headlines; inclusion is not a buy recommendation.
The app brings together company metrics, market context and analytical tools. This website does not publish a complete validated scoring formula. Signals should be assessed with their assumptions and risks rather than treated as certain outcomes.
Check a timestamped quote, company announcements, earnings guidance and sector performance. Several factors may contribute. A headline occurring near a price move does not by itself prove the cause.
Archived research carries its original date. A live quote must have a data source, timestamp and market-session label; an unlabeled screenshot is not a live quote. Forecasts are uncertain and are not guaranteed prices.
Public pages provide company research guides, article previews, a glossary and any separately published full articles. Subscription research and additional app tools remain available in the app.
Available on iOS and Android
Save a code before installing. Enter it at signup to connect this website visit to your account. It expires in 7 days.
 American Tower rose 11.28% to $202.05 in pre-market trading on October 23 at 9:25 AM Eastern, versus its $181.57 October 22 close, as tower shares rallied on reported SpaceX network plans.
 SBA Communications rose 10.64% to $197.37 in pre-market trading on October 23 at 9:27 AM Eastern, versus its $178.39 October 22 close, joining the tower-sector rally on reported SpaceX plans.
 The UK Competition and Markets Authority plans to propose rules requiring Apple to open up its tap-to-pay mobile wallet ecosystem.